Introduction
Animated maps for education are most useful when the movement helps answer a specific question. Instead of adding a moving map to a lesson because it looks interesting, decide what students should notice: a location, a sequence, a change in scale, or a relationship between places.
The seven ideas below are original planning examples, not claims that a particular animation improves grades or replaces teaching. Adapt them to your learners, check the geographic sources, and keep a still version available for discussion.
For a simple location-and-media sequence, explore AlbumMap. For broader teaching resources, Google Earth Education provides a starting point for geography-based learning activities.
1. Reveal a location after students make a prediction
Begin with a map at a scale that gives useful clues without immediately displaying the answer. Ask students to explain where they think the location might be and what evidence supports their guess.
Then reveal the label or move to a wider view. Keep the answer visible long enough to discuss which clues were useful. The animation's job is to reveal information in a deliberate order, not to turn the lesson into a speed test.
Prepare the question and expected reasoning before building the scene. Avoid using tiny labels or unfamiliar symbols as artificial difficulty. A static version with the same clues should still make sense.
2. Turn a field visit into a route explanation
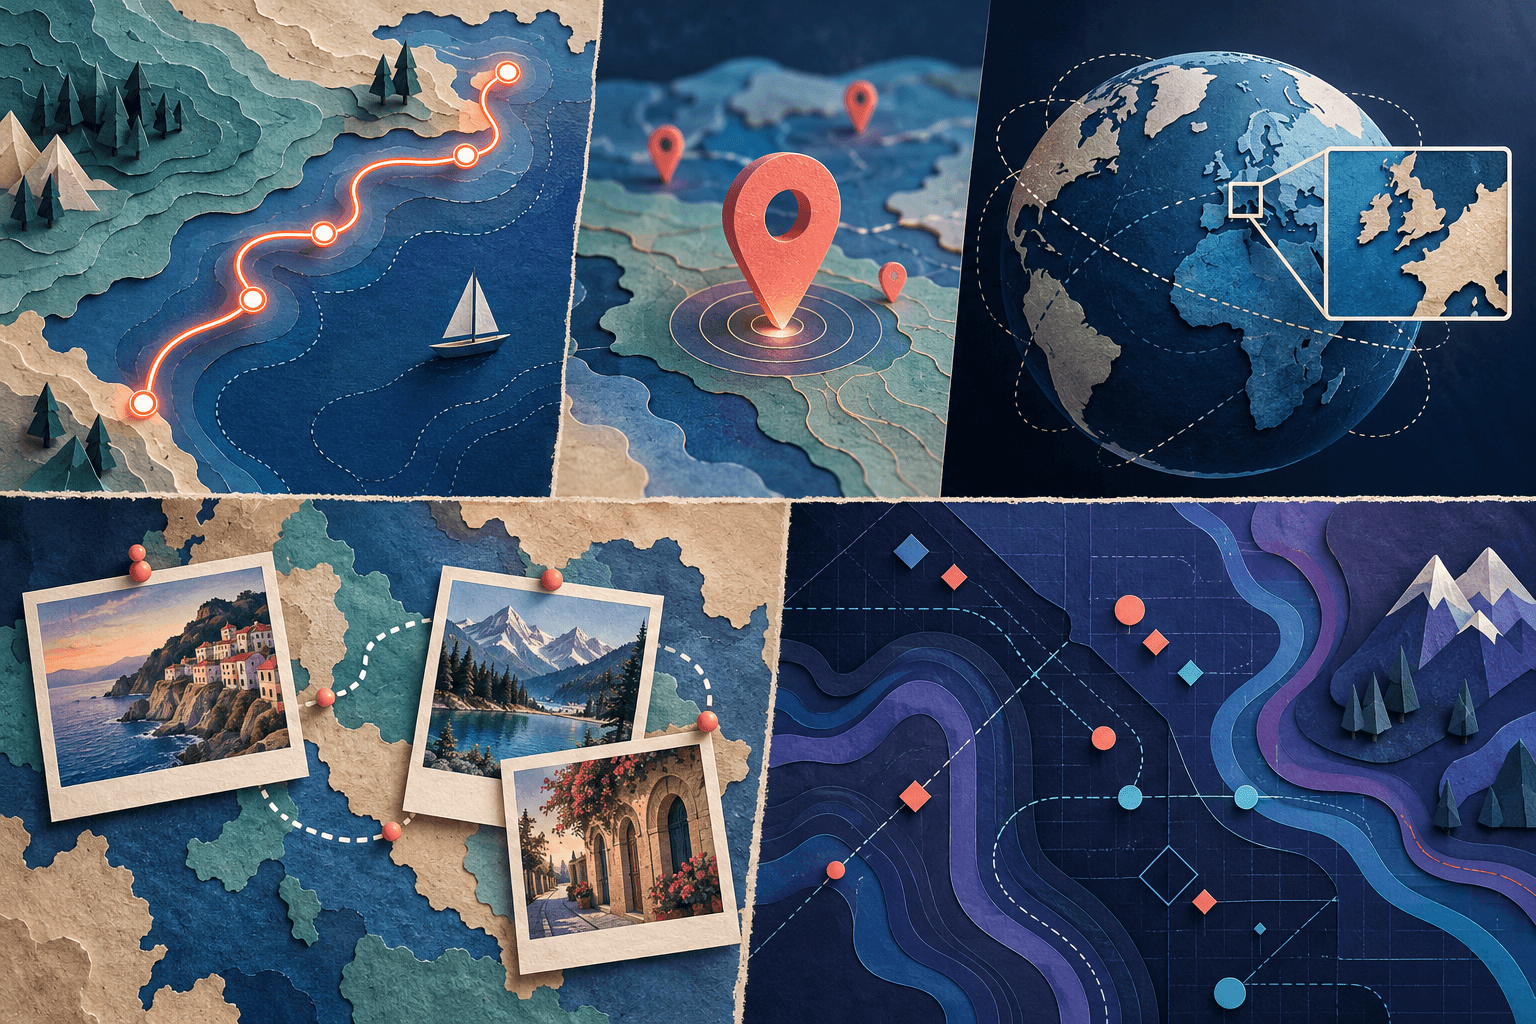
Show the starting point, two or three meaningful stops, and the finishing point. Attach a photograph or observation to each stop so the map explains where the evidence was collected.
For a fictional local field visit, one stop might introduce an observation, another might show a contrasting example, and the final stop might summarize what changed. The educational content comes from those comparisons, not from the moving line itself.
Use approved public locations and media. Avoid publishing students' homes, private travel patterns, or identifiable images without the appropriate permission. Describe a simplified connection as illustrative rather than presenting it as a safety or navigation guide.
3. Explain scale by moving from overview to detail
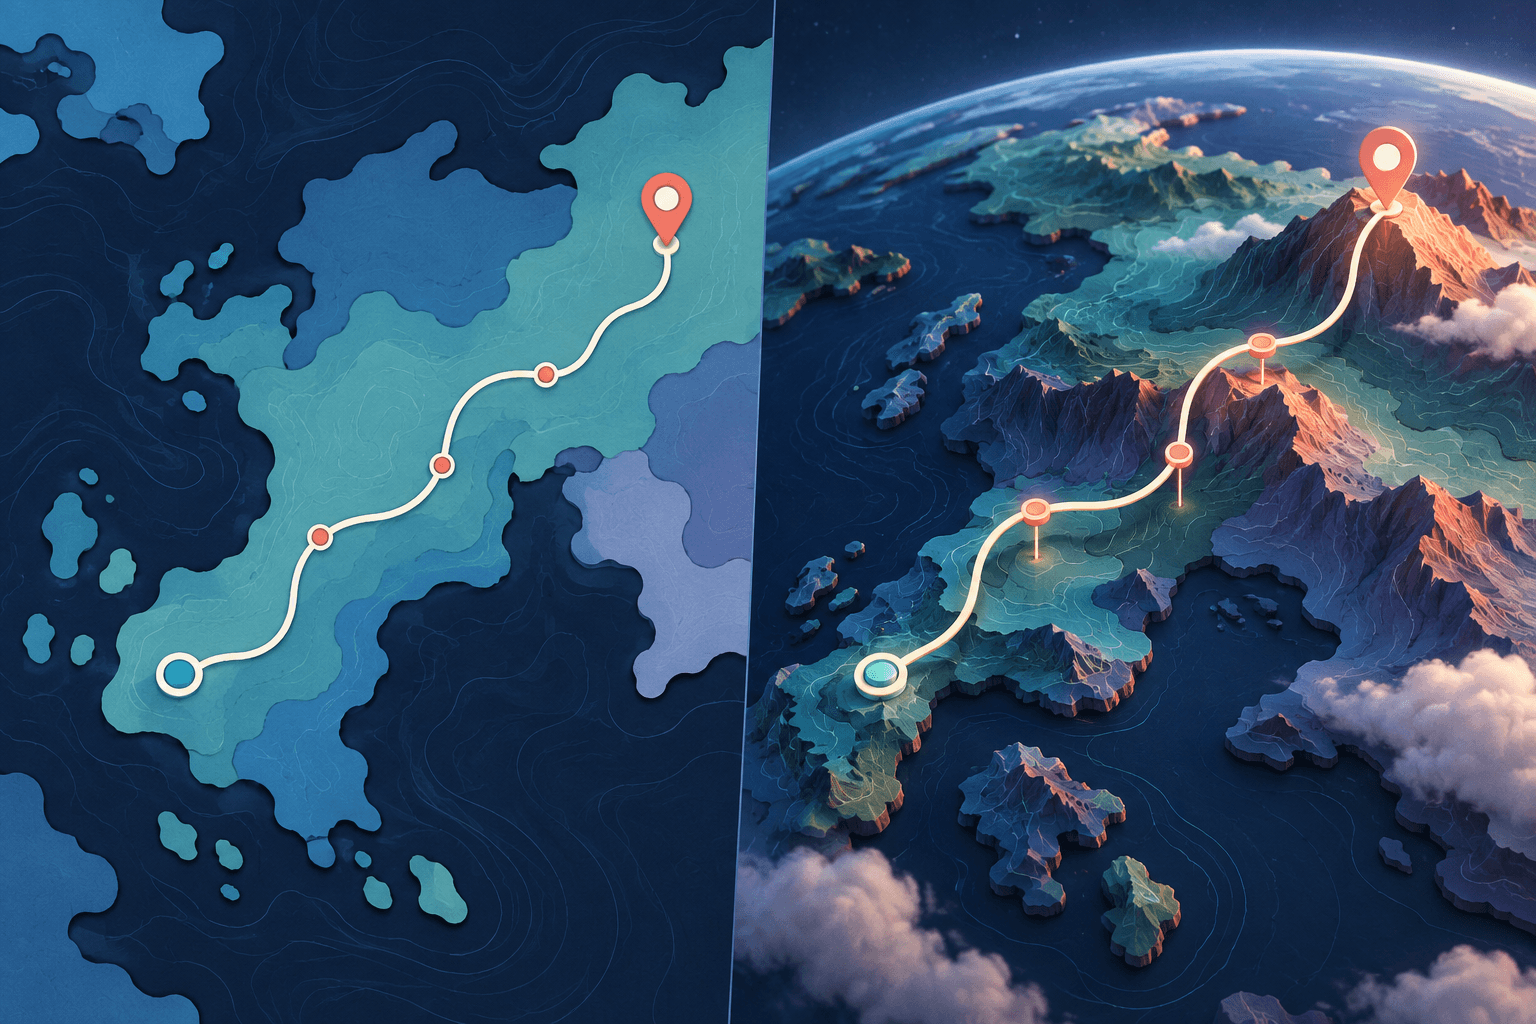
Choose one question that becomes easier to answer at a different scale. Begin with a regional view, approach the study area, and pause on the detail that matters.
Write a prompt for each view. At the broad scale, students might describe how the study area relates to surrounding places. At the closer scale, they might identify which features are visible or missing.
Do not use the zoom as a substitute for explaining scale. Put the two views side by side in a follow-up still when comparison matters. Our 2D versus 3D map-animation guide offers a way to choose the viewpoint deliberately.
4. Follow a physical feature in sections
A river, ridge, coastline, or other geographic feature can be introduced in short sections rather than one overloaded frame. Use a checked map or dataset and reveal only the segment being discussed.
Pair each section with a question: what can be observed here, how does it relate to the previous section, and what further evidence would be needed to explain it?
Keep observation separate from inference. A visible route line alone does not establish why a landform developed or how a process works. Add the relevant scientific explanation and sources rather than implying causation through animation.
When elevation or terrain is central, use a tool and dataset suited to that purpose. Do not assume that a general photo-and-route video maker provides scientific terrain analysis.
5. Build a dated historical location sequence
Use an animation to introduce places in chronological order while keeping dates and sources visible. The movement can explain the order of the presentation without pretending to reconstruct every journey precisely.
Create a source sheet for each scene. Record the date being discussed, the evidence for the location, and any uncertainty. Use an approximate area or a qualified label when a precise point would overstate the evidence.
Avoid placing a historical event onto modern boundaries without explanation. When the map is only a present-day locator, say so. Historical boundaries, population figures, and migration paths need appropriate dated sources and may require a separate mapping workflow.
A useful student question is: “What does this scene establish, and what remains uncertain?”
6. Compare two proposed journeys
Show two candidate sequences for a fictional field project or study trip. Ask students to compare them using stated criteria, such as the order of observations or the time available for planned activities.
Do not claim that a drawn connection provides real driving time, a safe walking route, or an optimized itinerary. Supply verified travel information separately when it is relevant.
Reveal the alternatives one at a time, then leave both visible in a still comparison. Ask students to justify a choice using the lesson's criteria rather than rewarding whichever route looks shorter on the screen.
This structure creates a reason to use animation for the introduction and a reason to stop animating for the discussion.
7. Let students create a short location explainer
Give learners a narrow brief: explain three places connected to the topic using one sentence and one approved visual for each. Require a source note and a final summary frame.
Assess the explanation, not the complexity of the effects. Useful criteria include whether the locations are correct, whether the sequence is understandable, whether sources are acknowledged, and whether the visuals support the message.
A simple map with clear narration can meet the brief better than a complicated camera tour with unsupported claims. Provide an alternative format, such as a labelled still map and written explanation, when animation is not suitable.
Build one short lesson scene before a full sequence
Use this original storyboard to test an idea:
| Scene | What to show | What to prepare |
|---|---|---|
| Question | A readable map and one prompt | The learning question in plain language |
| Context | The relevant area or starting point | Checked location information |
| Reveal | One movement or information change | The evidence the reveal should highlight |
| Explanation | A settled map with a brief note | The distinction between observation and interpretation |
| Discussion | A static summary | One question that requires reasoning |
Keep the draft short enough to review in one sitting. Play it without narration and check whether the labels still establish the setting. Then read the explanation aloud and make sure the visual change happens when it is relevant.
Keep sources and accessibility in the plan
Store the origin, date, and permitted use of each map, dataset, photograph, and clip. Add source information where viewers can connect it to the relevant claim. A generic credits slide does not explain which dataset supports a particular number or boundary.
Make the important information available without requiring viewers to follow continuous motion. Use pause points, readable captions, and a static summary. Avoid asking students to copy text while the map and the text are both moving.
If you need country fills, historical layers, quantitative overlays, or a scientific model, verify those capabilities in a suitable mapping tool. Esri's scene documentation illustrates the separate category of geographic scene authoring; those capabilities should not be assumed in AlbumMap.
Begin with the question students should answer
Choose one of the seven ideas, prepare the evidence, and build a small scene before producing the whole lesson. For an explainer organized around selected places and media, start a map video in AlbumMap.
Helpful answers
Frequently asked questions
How long should an educational map animation be?
Make it long enough to answer one question and short enough that each movement has a purpose. Test it with the intended reading and discussion pace rather than choosing a duration because it is fashionable online.
Should I use 3D for geography lessons?
Use it when the viewpoint helps explain the subject. A flat, still map may be better for comparing locations and reading labels. The learning task should determine the presentation.
Can students use their own location data?
Use only information that is appropriate to share and approved for the activity. A public project should not expose a student's home or personal movement history merely to make the animation more detailed.
Can AlbumMap create every educational map described here?
Use it for suitable location-and-media sequences. Data-driven boundaries, scientific overlays, and historical GIS work may need specialist tools and a separate video-editing step.