Introduction
An animated map for a school project should help the audience understand something, not simply make a still map move.
Start with one question. Where does a journey go? How are two places connected? What changes between one period and another? Then choose the smallest animation that makes the answer clearer.
This guide uses an original, fictional route-comparison exercise to show the process. The suggested sixty-second length is a planning example. Follow your teacher's actual assignment, assessment criteria, and time limit.
Turn the topic into a question
“Make a video about maps” is too broad to guide the edit. “How do two routes connect the school and library?” gives the audience something specific to follow.
Other useful project questions might compare the locations in a story, explain the order of stops on a researched journey, or show where a class collected observations. Choose a question your evidence can actually answer.
Avoid promising more than the map contains. A route line can show a path, but it does not by itself explain why people chose it, how long it took, or whether it remains accessible today.
Write the final answer in one sentence before opening the animation tool. That sentence will become the conclusion, and it can stop the project from growing into several unrelated topics.
Decide whether the assignment needs animation or interaction
An animated video plays in a planned order. An interactive map lets the viewer choose what to open or explore. These are different outputs.
When the assignment asks for a short presentation with a beginning and conclusion, a video may fit. When it asks users to click locations, inspect layers, or choose their own route through information, check whether an interactive map is required instead.
Do not spend the entire project making a polished video only to discover that the requested deliverable was clickable. Confirm the format in the instructions you already have.
For a general introduction to route presentation, see how to animate a route on a map.
Collect evidence before designing the map
For a factual topic, keep a record of each important location, date, measurement, and source. Distinguish an exact value from an estimate or a simplified illustration.
A planning table can be small:
| Claim or map element | Evidence to keep | What the viewer needs to know |
|---|---|---|
| A place's location | A suitable geographic source | The place name and the relevant area |
| A journey's order | The assignment's source material | Whether the route is recorded or reconstructed |
| A comparison value | The original data or calculation | Units and what is being compared |
| A past event | An appropriate historical source | The date and any uncertainty |
A modern map does not automatically show the geography of every historical period. For a history project, check names, borders, and routes against the period you are explaining.
For a fictional exercise, label it clearly. Fiction is useful for practising the method, but it should not look like a factual claim about a real place.
Use a map you are allowed to include
You can draw a simple fictional map yourself or use a map asset with terms that allow your intended use. Natural Earth provides public-domain map data and raster products that can support an appropriate geographic background.
Keep a source note even when the asset's terms do not require attribution. It helps the teacher distinguish your work from the geographic material behind it.
Do not assume every image found through search can be copied into a public video. Read the asset's actual terms and the school's instructions, particularly when the project will be posted beyond the classroom.
Use public or fictional locations rather than classmates' home addresses.
Choose the tool around the job
A simple moving-marker presentation can be made using the custom motion paths documented by Microsoft for PowerPoint. For a more designed graphic, Canva documents custom element animation. Both approaches require you to plan and verify the map rather than assuming the software calculates the geography.
For an advanced custom line reveal, Adobe documents shape-path animation in After Effects. Choose that route only when the editing complexity serves the assignment.
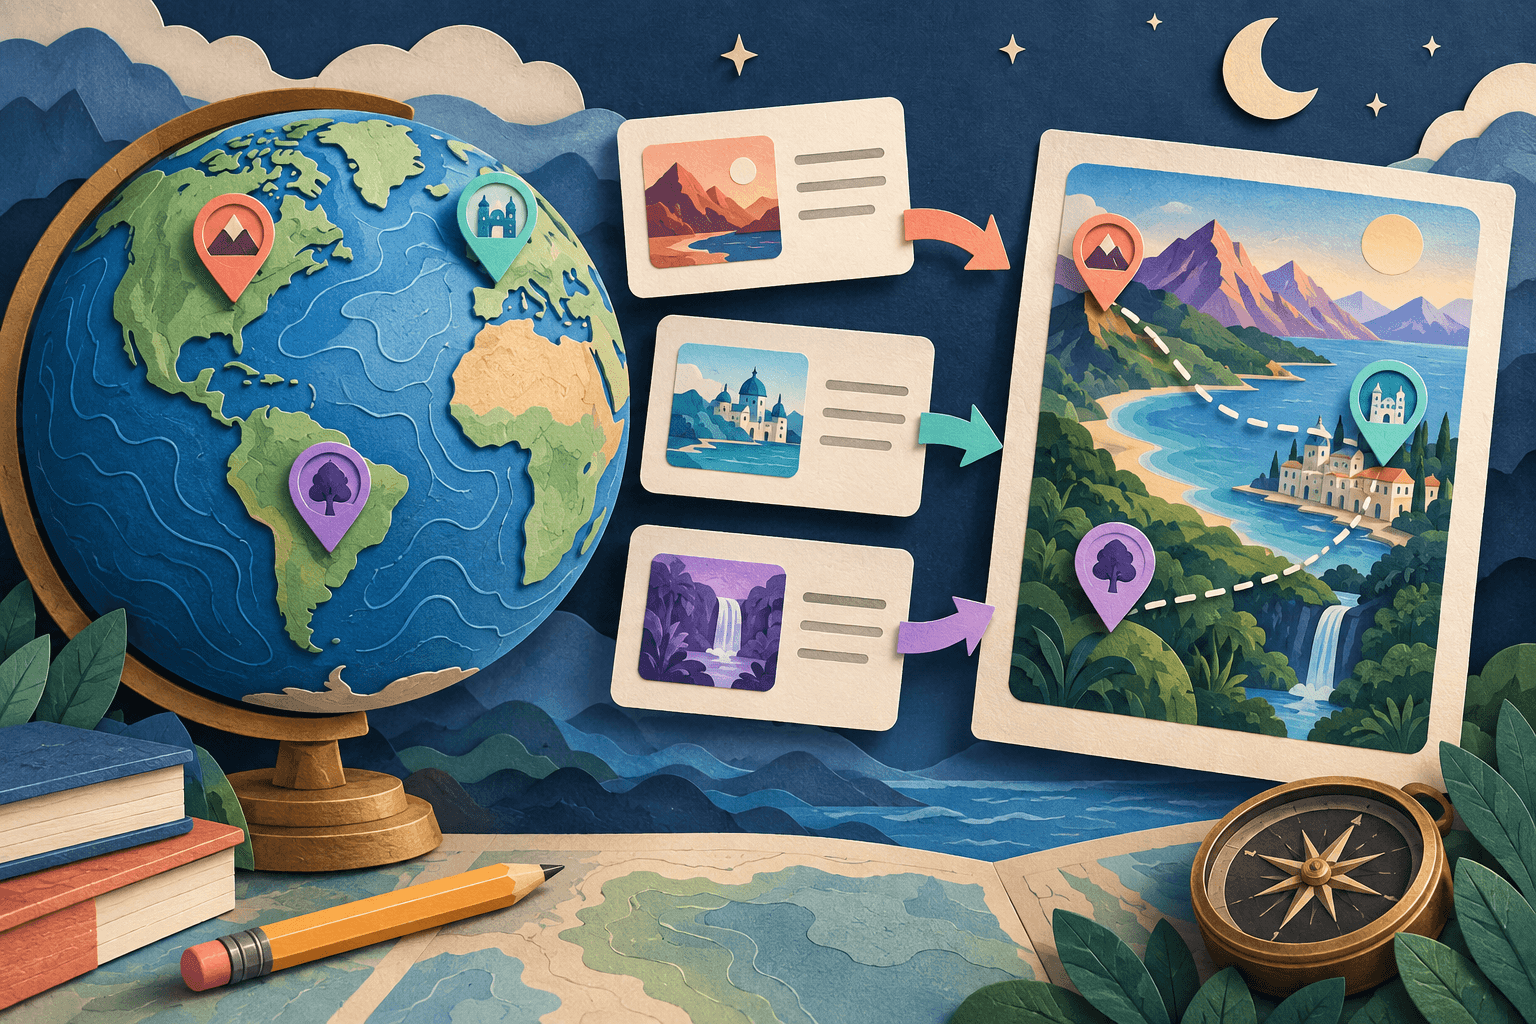
For a project built around photographs from meaningful places rather than data layers, a place-based memory-video workflow may be suitable. Do not treat a memory-video maker as a substitute for a specialist geographic-data tool.
A familiar tool that explains the question clearly is preferable to an unfamiliar tool chosen only because its examples look impressive.
Storyboard the explanation before animating
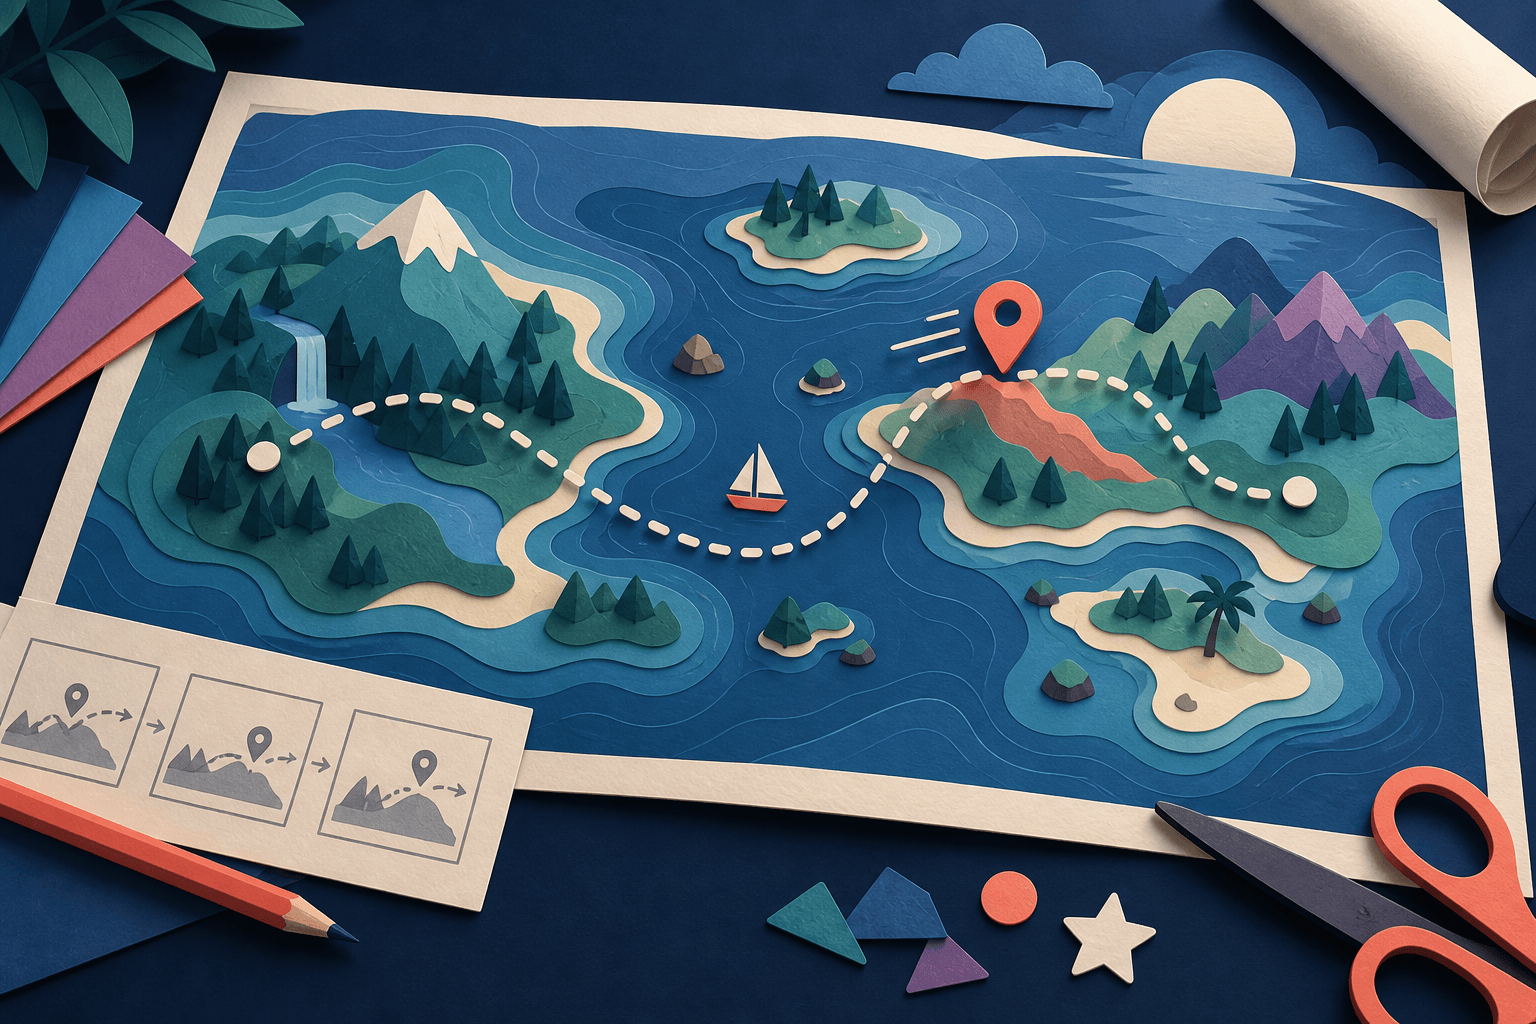
Use this fictional exercise: a school and a library are connected by two routes. Route A passes the park; Route B passes the market. No real distances or travel times are being claimed.
The question is not “Which is fastest?” There is no evidence for that. The question is “How do the two routes connect the same places differently?”
| Time | Scene | Information to communicate |
|---|---|---|
| 0–8 seconds | Show the fictional map and question | Identify the school and library. |
| 8–22 seconds | Reveal Route A | It goes through the park. |
| 22–36 seconds | Reveal Route B | It goes through the market. |
| 36–48 seconds | Show both routes together | Compare their different paths. |
| 48–60 seconds | State the conclusion and source note | Same endpoints, different route choices. |
The animation supports a modest claim that the map can actually demonstrate. You can replace this fictional exercise with researched material while preserving the same question-and-answer structure.
Write the narration in plain language
Here is an original sample script for the fictional exercise. Read it aloud and adjust the timing to your own speaking pace.
“This fictional map shows two ways to travel from the school to the library. The first route passes through the park before turning toward the library. The second route goes through the market. Both routes connect the same starting point and destination, but they pass different places along the way. The animation helps us compare the paths in order. It does not tell us which route is faster, because we have not measured distance, travel conditions, or time. To answer that question, we would need more information. For this project, the conclusion is simple: the same two places can be connected by different routes.”
Put the most important place names on screen, but do not fill the frame with every word of the narration.
Make the map understandable without colour alone
Label the routes “A” and “B.” You can also use different line patterns or reveal them one at a time. The viewer should not have to identify a colour to understand the comparison.
Keep the camera still while the main comparison is explained. A camera move is useful only when the audience needs to see a different area.
Provide accurate captions for speech and a text version of the main explanation. W3C's transcript guidance describes including important visual information in a descriptive transcript, which is particularly relevant when the meaning depends on a map.
For example, write “Route A passes the park” rather than relying only on the spoken words “this one goes here.”
Divide a group project into clear responsibilities
Assign someone to check sources, someone to organize the map and labels, someone to assemble the sequence, and someone to review the exported version. One person can take more than one role in a small group.
Keep a shared copy of the script and a list of sources. Decide together when the information is settled before one person spends time animating it.
For photographs, recordings, and identifiable students, follow the school's consent and sharing requirements. A classroom presentation and a public social-media post should not be treated as the same audience.
Test the finished video against the question
Show it to someone who has not helped with the project. Ask them to explain what the map demonstrates.
When their answer differs from your intended conclusion, revise the structure or labels before adding more effects. A useful final check is whether each animated movement contributes information.
Watch the actual exported file and check legibility, sound, missing frames, source notes, and any accidental private details. Keep the project file as well as the video in case the teacher requests a correction.
Make the conclusion more memorable than the effect
A strong map project gives the audience one clear answer and enough evidence to trust it. Start there, then animate only what helps the explanation.
For a class-trip memory story rather than a data presentation, explore AlbumMap's travel video maker and organize the film around the places the group experienced together.
Helpful answers
Frequently asked questions
Does an animated map need to be three-dimensional?
No. A clear flat map can be enough. Choose the view that best explains the question rather than the one with the most movement.
Can I use a fictional map?
Yes, when it fits the assignment and is clearly labelled. Use real sources when the task requires factual geography or history.
Do I need a moving vehicle?
No. A revealed line, a highlighted area, or a sequence of labels may explain the topic more clearly.
When would AlbumMap fit a school-related video?
Consider a place-and-photo story for a class trip or a shared memory project, subject to school approval. A factual data visualization may need a different tool. AlbumMap's video overview can help you decide whether the workflow matches the task.