Introduction
Cities that changed dramatically make time easy to see. A shore can become a busy waterfront. Old rail land can become a new district. A road can become a place to walk. These ten stops offer a simple way to look at the past and present: pick one place, add a date, and mark it on a map. The video below gives a quick route through each example.
How to look at a changed place
The best before-and-after views stay close to one spot. A whole city is too large for a fair match. A river edge, square, rail yard, or tower gives your eye a fixed point. The city may change around it, but the place still has a name and map pin.
Start with a dated old view or event. Then find a recent view from the same area. Say only what the images and source show. A new path, a rebuilt shore, or a taller skyline is easy to see. Bigger claims need more reporting and more sources.
This list does not rank cities. It simply shows ten visible changes. The video is short, so the table gives each stop a date anchor, map point, and timestamp. Use it as a guide for more local reading.
The ten-stop video route
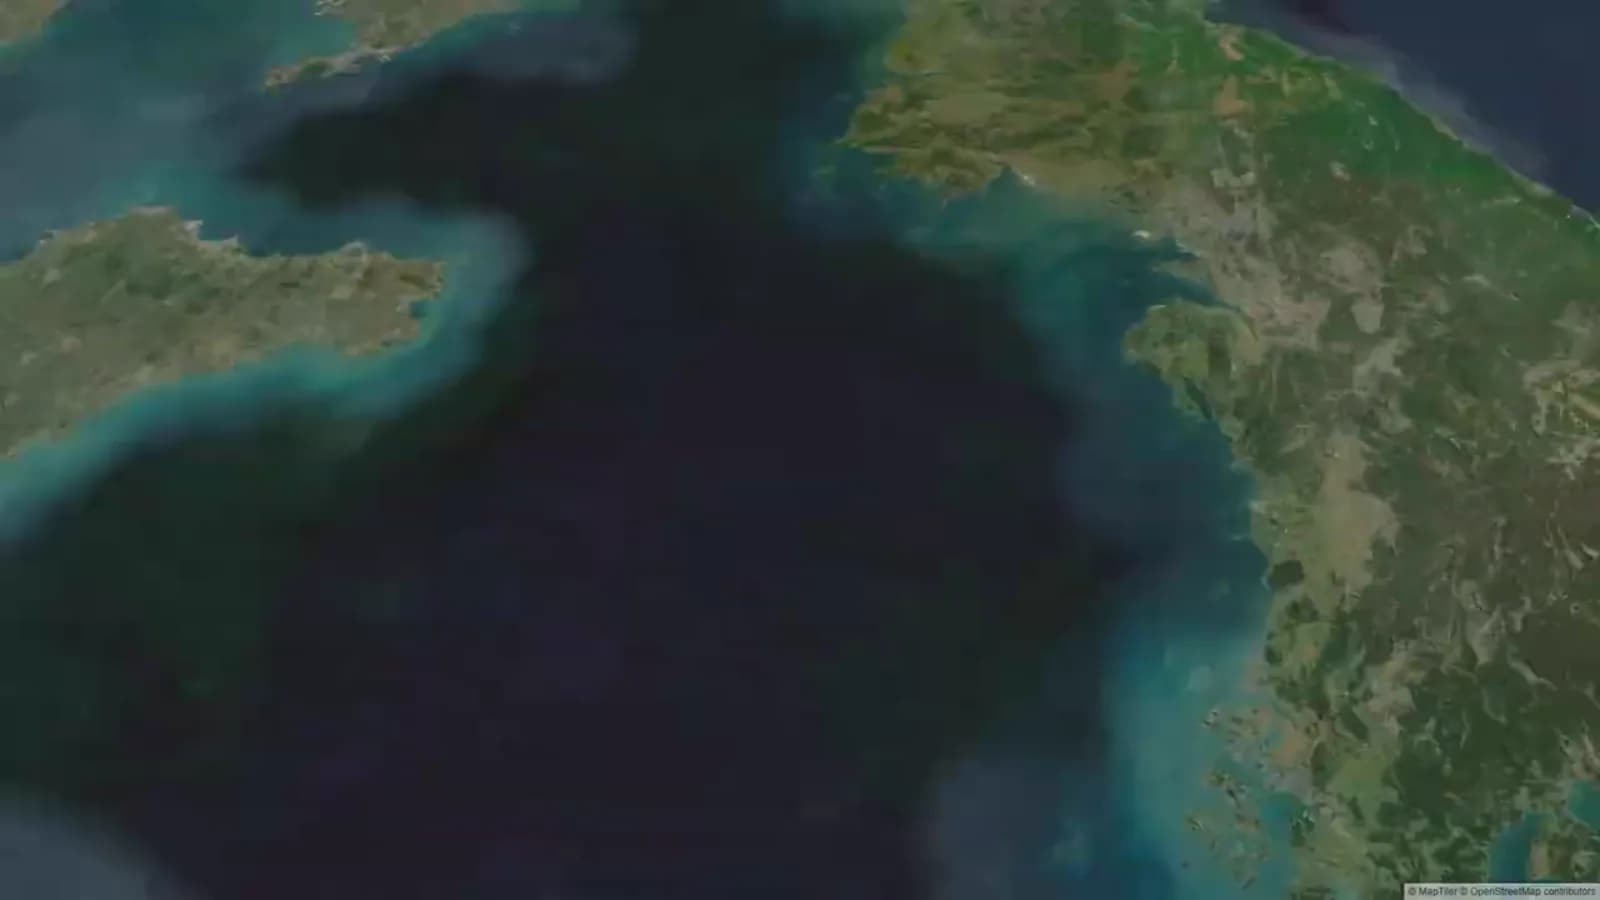
The route starts in Pudong, Shanghai. It then moves to Marina Bay in Singapore and Cheonggyecheon in Seoul. Next come Potsdamer Platz in Berlin, Barcelona’s waterfront, and Bilbao’s riverfront. Dubai, King’s Cross, Times Square, and the Eiffel Tower in Paris finish the route.
The places span Asia, Europe, the Middle East, and North America. They include shores, a stream, a rail district, tall skylines, a square, and a landmark. Urban development before and after does not have one look. Some projects add buildings. Some bring water or walking space back into view.
To study a stop, pause the video at its time. Find the same point on a map. Put an old and new view side by side. Add one plain sentence and a source for the date. This method works for a class project, a trip journal, or a family story.
1. Pudong, Shanghai
Pudong opens the video at 00:06. An official Pudong source dates the start of development to April 1990. That gives a clear point for a skyline view around Lujiazui.
Keep the frame tight. Look at the river-facing district, not all of Shanghai. Note the date of the old image and the map point. A short caption can describe the move from an early stage of growth to a dense skyline.
2. Marina Bay, Singapore
Marina Bay appears at 00:17. It is a helpful shore example because land reclamation and later planning shaped the bay. The Urban Redevelopment Authority gives the key milestones.
Use the Marina Bay waterfront as the map point. Compare the shore, the open edge, and the buildings. Keep the claim small and clear. One photo cannot explain all of Singapore, but it can show a real change at this part of the bay.
3. Cheonggyecheon, Seoul
Cheonggyecheon appears at 00:31. Work to restore the stream began in July 2003. It reopened on October 1, 2005. Those dates make a clear short timeline.
The visible story is simple. The stream corridor became a public place. Show the same part of Cheonggyecheon Stream, name the dates, and say what the view shows. Change is not always a taller skyline. It can mean water, paths, and a new way to move through an area.
4. Potsdamer Platz, Berlin
Potsdamer Platz appears at 00:45. Berlin’s official visitor information describes major rebuilding in the 1990s. The named square gives the story a firm center.
Pair an older view with a current image from Potsdamer Platz. Explain that rebuilding changed the setting around this central place. Keep the caption brief. A reader should find the place, time frame, and source without a long lesson.
5. Barcelona Waterfront
Barcelona’s waterfront follows at 00:55. Port Olímpic was built in 1990 for the sailing events of the 1992 Olympics. The date and location make a useful pair.
Use Port Olímpic, not the full coast. Compare an earlier view with the Olympic-era waterfront and a current view when one is available. This gives the reader one clear area to study. It also avoids treating a long coast as one project.
6. Bilbao Riverfront
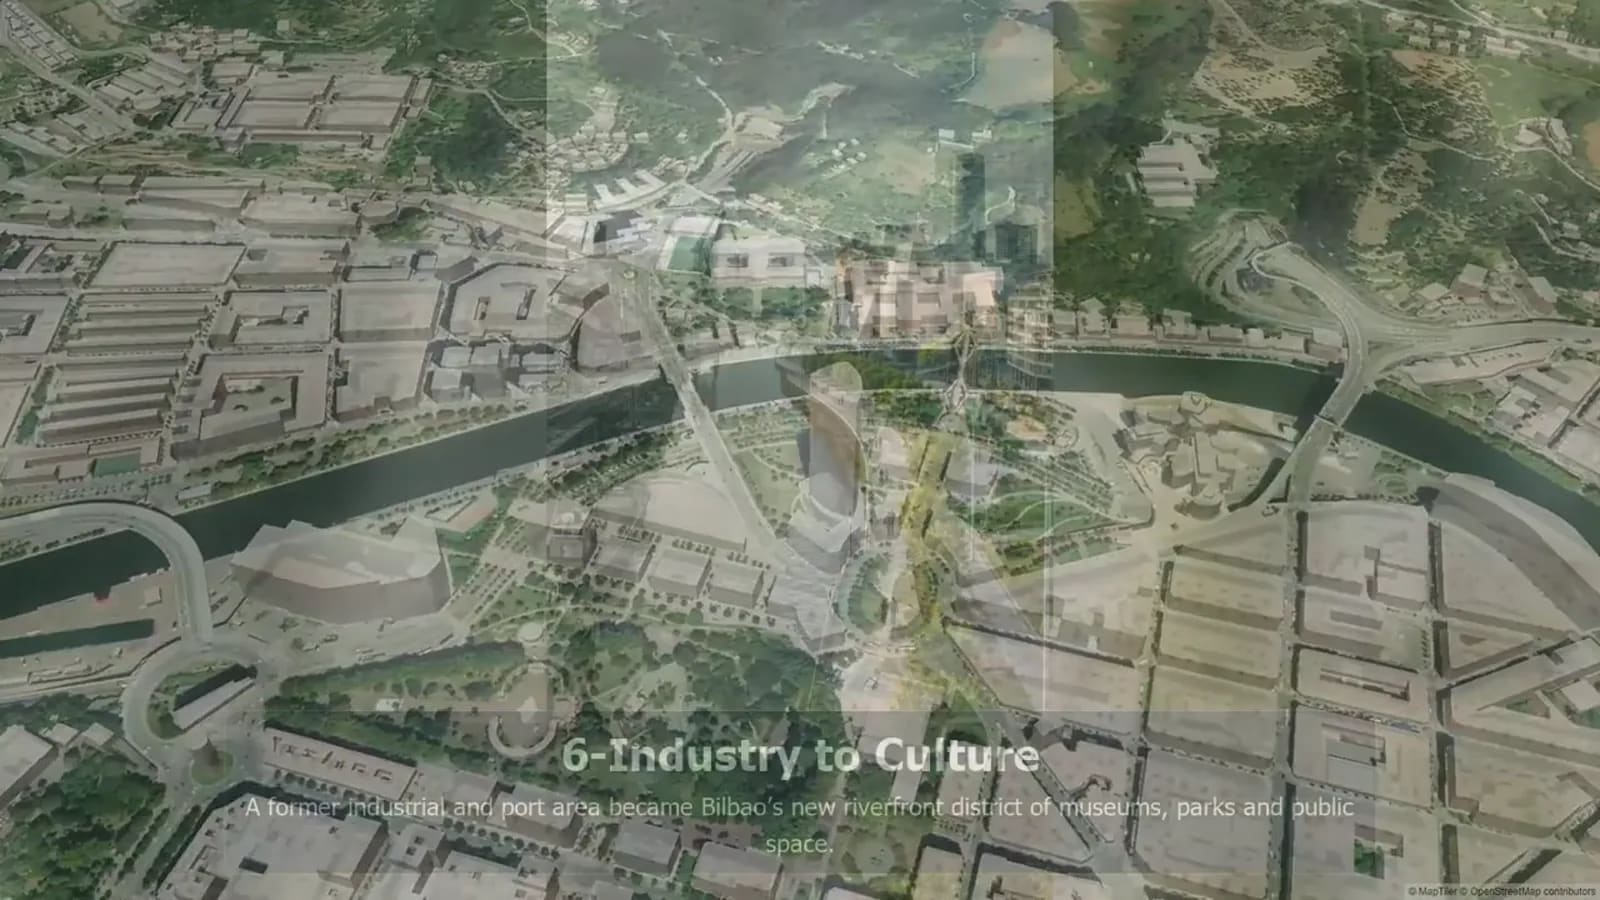
The Bilbao riverfront appears at 01:09. The Port of Bilbao states that Bilbao Ría 2000 was formed in 1992 for regeneration work. A 1997 Guggenheim-era view can mark a later stage.
Set the map pin at Abandoibarra. Then use plain words: an industrial river edge became part of a renewed urban area. That is a short summary, not the full story. Link the source and let the images show the physical change.
7. Dubai Skyline
Dubai’s skyline appears at 01:21. It is a fast and striking part of the video, but it needs care. A skyline covers many sites, and each site has its own dates and image record.
Pick one exact view before writing a date. Downtown Dubai can be a map label, but it is not enough on its own. Find a dated old image and a dated current image of the same view. Until then, call this a visible skyline comparison, not proof of one set timeline.
8. King’s Cross, London
King’s Cross appears at 01:33. Early work on its redevelopment began in June 2007. The King’s Cross development site gives first-party facts about the wider project.
Use King’s Cross Central as the map point. Compare the older rail and industrial setting with a current public view. Name the district and date in the caption. Then link to the source for the wider story.
9. Times Square, New York
Times Square arrives at 01:47. New York City’s pedestrian-plaza pilot ran from February to August 2009. That gives a useful date for the Broadway section between West 42nd and West 47th Streets.
The best image pair shows the street space. One view can show the earlier traffic pattern. The other can show the pedestrian-plaza layout. Do not claim that one project changed all of Midtown. This short street section is enough to make the shift easy to see.
10. The Eiffel Tower, Paris
Paris closes the route at 01:59 with the Eiffel Tower. Construction began in January 1887. The tower was complete on March 31, 1889. This stop centers on a landmark, not a new district.
Show the tower’s arrival on the Champ de Mars and its place in a current Paris view. It is a useful final point: change can be old. A before-and-after pair does not need a recent project. It needs a sound date, a fixed place, and a clear view.
Make a then-and-now map story of your own
Start with one route that matters to you. It may be a childhood street, a honeymoon city, a school trip, or a family holiday. Ask each person for an old photo, a current photo or clip, a short note, and the place where it happened.
Put the stops in a clear order. You can follow dates, travel order, or one shared theme. Use short labels such as “first visit,” “ten years later,” or “where we met.” Check place names before you share the project. If you add public history, link to a source and keep it apart from personal memory.
AlbumMap can bring approved photos, clips, messages, and locations into a map-led video. The goal is not to make every stop grand. It is to show why the route matters to the people in it. A familiar corner can hold as much meaning as a famous skyline.
Ten-City Transformation Table
Use this table as a quick video guide and planning checklist for dated, mapped comparisons. Verify each date against its source before publishing an image pair.
| Video stop | Before date to verify | After date to verify | Mapped point | Video timestamp | Canonical-page action |
|---|---|---|---|---|---|
| Pudong, Shanghai | 1990 development launch | Current view at publication | Lujiazui, Pudong | 00:06 | Add to the canonical article with a dated image pair. |
| Marina Bay, Singapore | 1971 reclamation begins | Current view at publication | Marina Bay waterfront | 00:17 | Add source-linked before-and-after views. |
| Cheonggyecheon, Seoul | July 2003 restoration begins | October 1, 2005 reopening and current view | Cheonggyecheon Stream | 00:31 | Use the restoration dates and a focused stream view. |
| Potsdamer Platz, Berlin | 1990s redevelopment period | Current view at publication | Potsdamer Platz | 00:45 | Use a location-specific historic image. |
| Barcelona Waterfront | 1990 Port Olímpic construction | 1992 Olympic-era waterfront | Port Olímpic | 00:55 | Keep the comparison limited to Port Olímpic. |
| Bilbao Riverfront | 1992 regeneration body formed | 1997 Guggenheim-era change and current view | Abandoibarra | 01:09 | Link the regeneration source. |
| Dubai Skyline | Date must be verified at item level | Current view at publication | Downtown Dubai skyline | 01:21 | Do not add a dated claim until visual sources are selected. |
| King's Cross, London | June 2007 early works | Current view at publication | King's Cross Central | 01:33 | Use a focused district comparison. |
| Times Square, New York | February-August 2009 pedestrian-plaza pilot | Current view at publication | Broadway, West 42nd to West 47th Streets | 01:47 | Show the street-space change. |
| Eiffel Tower, Paris | January 1887 construction begins | March 31, 1889 completion and current view | Champ de Mars, Paris | 01:59 | Use a landmark-focused comparison. |
Examples You Can Copy
Family trip route
Map a family’s first visit to Paris, a later photo from the Champ de Mars, and a short note about what each person remembers.
Neighborhood memory
Pair an old photo of a local square with a new clip from the same corner, then label the stop with the year and one shared memory.
Final Thoughts
The best city comparisons stay simple: one place, two dates, a clear view, and a source. Use that structure to explore public change or to preserve the places that changed around your own shared memories.
Helpful answers
Frequently asked questions
What are examples of cities that changed dramatically?
This article uses ten focused places: Pudong, Marina Bay, Cheonggyecheon, Potsdamer Platz, Barcelona’s waterfront, Bilbao’s riverfront, Dubai’s skyline, King’s Cross, Times Square, and the Eiffel Tower area in Paris.
How can I make a fair before-and-after city comparison?
Use a fixed location, dated images from the same general viewpoint, a short factual caption, and a source for the date and context. Do not make claims that the images or source do not support.
Why are dates and map points important?
They keep a comparison clear. A date sets the time frame, and a map point shows the exact area being discussed instead of implying that an entire city changed in one way.
Can I make a map video from personal travel memories?
Yes. Gather approved photos, clips, messages, and locations from a trip or shared chapter, then arrange them as a route. AlbumMap can turn those contributions into a map-led video.